Huib Wursten, Public speaker, Author and Consultant
E-mail: huibwursten@gmail.com
Paulo Finuras, Ph.D.
E-mail: paulo.finuras@isg.pt
Abstract
Football is the most popular sport on the planet. It contains tribal elements adorned by rituals that summon emotional aspects and ancestral elements associated with the evolution and interaction of human groups, including competition and cooperation. National culture, understood as the groups wise collective mental software is present in all societies and penetrates them in all areas so that the practice of this game cannot be, in different ways, immune to it or “cultural free”. In this article we propose to analyze the influence of cultural values both on the disciplinary aspect (total cards shown by referees in the games of various European Football Leagues) as well as the effective time played (ETP) that is, the one that results from the non-interruptions per action of the referee in response to situations that he interprets as being sanctioned (therefore the time required to mark a ball that comes out or a corner that is considered as playing).
Our research hypotheses are that the values of national cultures also influence both the number of cards shown and the effective playing time which means that effective playing time of a football match and the cards showing greatly varies according to cultural environment football leagues.
This should not, in fact, be a huge surprise because the human activities of interpreting the rules of the game and the use of the power instituted in the figure of the referee are not exempt from the unconscious influence of the cultural context of the referees’ origin.
In short, with this research we may claim that the cultural background of the origin of referees tends to promote inevitable distortions in the way they intervene in the game to exercise their regulatory power.
Keywords
Individualism, National Culture, Power Distance, Uncertainty Avoidance, Effective Playing Time, Total Cards Shown
Content
1.1 The implications for relationship trainer and player. 4
- Objective. 6
- Methods. 6
- Hypothesis, Discussion and Results. 7
- From moderate (*) to strong (**) significant correlations. 14
1. Introduction: The Hofstede Model and the Culture shock:
In an interview ( 20-12-19) with newspaper Nice-Matin, OGC Nice and Danish international striker Kasper Dolberg complained about the style of refereeing in Ligue 1. Comparing with his experience in the Netherlands with his new environment, France, he said:
“You can’t even speak with them (the referees) here. In the Netherlands, you speak man to man, you can ask for an explanation when a decision seems strange. Here, you get a yellow card even without looking at them! I don’t know if they don’t like me or whether there is another reason, but it is crazy. I’ve understood that I should not even try to speak with them.”
It is a clear example of that cultural differences can cause in playing soccer in different cultural value systems. Even if the countries are not very far away.
The social scientist Geert Hofstede proposes and defines culture as “a collective mental program of the human mind that characterizes and distinguishes one group or category from another”. In other words, culture is understood as a system of patterns and meanings about how to think, feel and act on common existential issues: how to deal: 1). with hierarchy; 2) the balance between the Individual and group loyalty; 3) the direction of motivation: competition or consensus seeking; and (4) the need to control uncertainty.
In its proposal, national culture, seen as mental software, is composed of ‘layers’. At its core are the values, understood as ‘general preferences for one state of affairs in relation to another, to which very strong[1] emotions and feelings are associated’.
The first three layers consist of symbols, heroes and rituals and are the most permeable to change and the most visible. The latter (values) is not visible mainly to a foreigner. The dimensions, which are analytical constructions, reveal the meaning (high or low) and the intensity (strong or weak) in the way societies solve the four existential issues listed above. This is where the variations in values arise in the understanding of G. Hofstede (see next figure).

Figure 1
National Culture as a central tendency
The model based on the seminal study known today as the “IBM Study” has since been reinforced by the outcomes of repeat research, (Hofstede, 2010). The underlying idea is that when we compare the distribution of values between populations the rule of large numbers allows to find a central trend (what most people do most of the time) that can be compared to other national distributions.
Fig. 2
The first 4 Dimensions of the original Hofstede Model

Source: Authors adaptation from Hofstede, 2010
This model allows to anticipate some behaviors as more likely (because statistically predictable), from the comparison of central trends between national cultures. Let us look further as an example to the four dimensions and same of the characteristics more likely to happen in the relation between coach and players:
1.1 The implications for relationship trainer and player.
| Low…………………. | Power Distance | ………………..High |
| Coaches expect/accept that players to initiate communication | Players tend to wait until the Coach begins to communicate. |
| Players can/should find their own way, show initiative. | Players know that coaching determines the direction. |
| Players can spontaneously open their mouths | Players wait to speak until they are asked or invited to do |
| Players can ccontradict if they have different opinions | Players in general never contradict the Coach. |
| Low IDV
(collectivist) |
Individualism |
High IDV
(individualistic) |
| Coach nor player should lose face | Confrontation can be useful |
| Great loyalty to “in” group.
Other rules for outsiders. |
Face loss is not that important. |
| Harmony must remain | Coaches are impartial |
| Of coaches is accepted that they are traits based on background or recommendation of important person. |
The same rules for everyone |
| Consensus | Masculinity | Competitive |
| Players are supposed to be modest. | Stars are allowed to profile and expect other treatment. |
| Coaches should avoid to publicly praise good players too much. | Coaches can praise good players publicly. |
| Be critical to each other = keep each other sharp.
Help each other |
Criticizing = negativism
Competition between colleagues is tolerated |
| If you come up with your head above ground level… you will pay the consequences | Players very visible. |
| Low/Weak | Uncertainty Avoidance | High/Strong |
| Coaches don’t lose credibility right away when they say, “I don’t Know” | Coaches are expected to have all the answers. |
| Players are rewarded for flexible solutions in the field and for creativity. | Players are rewarded for precise follow-up of tactical clues. |
| Coaches are expected to suppress or control showing emotions during the game. | Coaches may be emotional in public and private |
| Coaches interpret discord as potentially stimulating. | Coaches see discord as personal disloyalty. |
| Coaches accept in principle input from all involved. | Coaches see themselves as experts who can learn nothing more from others. |
2. Objective
Following cross-cultural psychology Hofstede Model, we postulate that cultural values matters in referees’ preferences regarding the tendency to show more or less cards in football games (i.e., exercise sanctioning power) and in the impact, as consequence, on final effective playing time.
3. Methods
We present a study of original data to assess the amount of yellow and red cards showing and the effective playing time in several European football leagues with statistical and analytical methods including correlations between cultural values and those statistics (EPT, TCS). All the statists were kindle provide by the CIES Football Observatory, 2018
We have specific statistics of Red Cards Shown (RCS) from 25 football leagues in 2016-2017 and yellow and red cards from 2018-2019 and 2019 and 2019-2020 (until 17/02/2020) including statistics from the Effective Playing Time.
Our research hypothesis is that the dimensions characteristics from the cultural environment of the matches could influence referees in showing more or less cards and therefore the effective playing time could be reduced.
4. Hypothesis, Discussion and Results
In addition to the actual time played we will analyze the total cards shown, red cards and yellow cards in 25, 31 and 73 leagues around the world,
We will consider several hypothesis, namely:
H1: In cultures with a higher PDI, referees show more cards in general (yellow and red)
H2: In cultures with higher PDI referees show more red cards than in cultures with lower PDI
H3: In cultures with a higher UAI, referees show more cards in general (yellow and red)
H4: The cultural dimensions PDI, IDV and UAI influence the effective playing time
H5. In cultures of strong uncertainty avoidance, the referees try to control the game by displaying yellow and red cards
The findings are consistent with the Hofstede Model theory presented here revealing great discrepancies according to the cultural background environment of the football leagues.
Our research suggest that referees are unconsciously influenced by Power Distance, Individualism, and Uncertainty Avoidance values where the match occur showing more or less cards and intervening and interrupting more or less the matches.
In conclusion, our data suggest that referees are more likely to demonstrate the power in high power distance societies, special with stronger uncertainty avoidance.
Fig. 3
Where Refs brandish yellow and red most

Source: CIES Football Observatory, 2018
Graphic 1

Source: Author’s research & data from CIES Football Observatory, 2018
Table 1Correlations Average Red Cards Shown in 2016-2017 for 25 European Leagues |
||||||
| RC
2016-2017 |
PDI | IDV | MAS | UAI | ||
| Red Cards
2016-2017 |
Pearson Correlation | 1 | ,504* | -,415* | ,263 | ,761** |
| Sig. (2 tails) | ,010 | ,039 | ,204 | ,000 | ||
| N | 25 | 25 | 25 | 25 | 25 | |
| PDI | Pearson Correlation | ,504* | 1 | -,637** | ,230 | ,574** |
| Sig. (2 tails) | ,010 | ,000 | ,184 | ,000 | ||
| N | 25 | 35 | 35 | 35 | 35 | |
| IDV | Pearson Correlation | -,415* | -,637** | 1 | ,000 | -,573** |
| Sig. (2 tails) | ,039 | ,000 | 1,000 | ,000 | ||
| N | 25 | 35 | 35 | 35 | 35 | |
| MAS | Pearson Correlation | ,263 | ,230 | ,000 | 1 | ,177 |
| Sig. (2 tails) | ,204 | ,184 | 1,000 | ,309 | ||
| N | 25 | 35 | 35 | 35 | 35 | |
| UAI | Pearson Correlation | ,761** | ,574** | -,573** | ,177 | 1 |
| Sig. (2 tails) | ,000 | ,000 | ,000 | ,309 | ||
| N | 25 | 35 | 35 | 35 | 35 | |
| *. The correlation is significant at level 0.05 (1 tail). | ||||||
| **. The correlation is significant at level 0.01 (2 tails). | ||||||
Graphic 2 – RED CARDS & PDI

Source: Author’s research based on data from CIES Football Observatory, 2018
Graphic 3 – RED CARDS & IDV

Source: Author’s research based on data from CIES Football Observatory, 2018
Graphic 4 – RED CARDS & UAI

Source: Author’s research based on data from CIES Football Observatory, 2018
Red Cards, Yellow Cards & Effective Playing Time in 2018-2019
Table N.º 2Correlations TCS, EPT YC, Y2CRC & Cultural Values – 2018-2019 |
||||||||||
| TCS | EPT | YC | Y2C | RC | PDI | IDV | UAI | MAS | ||
| Total Cards Shown
TCS |
Pearson Corr. | 1 | -,560** | ,996** | ,826** | ,370* | ,377* | -,557** | ,623** | ,314 |
| Sig. (2 tails) | ,003 | ,000 | ,000 | ,029 | ,026 | ,001 | ,000 | ,066 | ||
| N | 35 | 26 | 35 | 35 | 35 | 35 | 35 | 35 | 35 | |
| Effective Playing Time
EPT |
Pearson Corr | -,560** | 1 | -,581** | -,380 | ,037 | -,151 | ,475* | -,537** | -,370 |
| Sig. (2 tails) | ,003 | ,002 | ,055 | ,856 | ,463 | ,014 | ,005 | ,063 | ||
| N | 26 | 26 | 26 | 26 | 26 | 26 | 26 | 26 | 26 | |
| Yellow Cards
YC |
Pearson Corr | ,996** | -,581** | 1 | ,782** | ,332 | ,364* | -,539** | ,602** | ,326 |
| Sig. (2 tails) | ,000 | ,002 | ,000 | ,051 | ,032 | ,001 | ,000 | ,056 | ||
| N | 35 | 26 | 35 | 35 | 35 | 35 | 35 | 35 | 35 | |
| Second Yellow Card
Y2C |
Pearson Corr | ,826** | -,380 | ,782** | 1 | ,258 | ,419* | -,616** | ,606** | ,194 |
| Sig. (2 tails) | ,000 | ,055 | ,000 | ,134 | ,012 | ,000 | ,000 | ,265 | ||
| N | 35 | 26 | 35 | 35 | 35 | 35 | 35 | 35 | 35 | |
| Red Cards
RC |
Pearson Corr | ,370* | ,037 | ,332 | ,258 | 1 | ,069 | -,092 | ,346* | ,032 |
| Sig. (2 tails) | ,029 | ,856 | ,051 | ,134 | ,696 | ,597 | ,041 | ,857 | ||
| N | 35 | 26 | 35 | 35 | 35 | 35 | 35 | 35 | 35 | |
| PDI | Pearson Corr | ,377* | -,151 | ,364* | ,419* | ,069 | 1 | -,637** | ,574** | ,230 |
| Sig. (2 tails) | ,026 | ,463 | ,032 | ,012 | ,696 | ,000 | ,000 | ,184 | ||
| N | 35 | 26 | 35 | 35 | 35 | 35 | 35 | 35 | 35 | |
| IDV | Pearson Corr | -,557** | ,475* | -,539** | -,616** | -,092 | -,637** | 1 | -,573** | ,000 |
| Sig. (2 tails) | ,001 | ,014 | ,001 | ,000 | ,597 | ,000 | ,000 | 1,000 | ||
| N | 35 | 26 | 35 | 35 | 35 | 35 | 35 | 35 | 35 | |
|
UAI |
Pearson Corr | ,623** | -,537** | ,602** | ,606** | ,346* | ,574** | -,573** | 1 | ,177 |
| Sig. (2 tails) | ,000 | ,005 | ,000 | ,000 | ,041 | ,000 | ,000 | ,309 | ||
| N | 35 | 26 | 35 | 35 | 35 | 35 | 35 | 35 | 35 | |
| MAS | Pearson Corr | ,314 | -,370 | ,326 | ,194 | ,032 | ,230 | ,000 | ,177 | 1 |
| Sig. (2 tails) | ,066 | ,063 | ,056 | ,265 | ,857 | ,184 | 1,000 | ,309 | ||
| N | 35 | 26 | 35 | 35 | 35 | 35 | 35 | 35 | 35 | |
| *. The correlation is significant at level 0.01 (2 tails). | ||||||||||
|
Source: Author’s research based on data from CIES Football Observatory, 2018 and Hofstede Database |
||||||||||
| Graphic 5 – PDI & Effective Playing Time
|
| Graphic 6 – IDV & Effective Playing Time 2018-2019
|
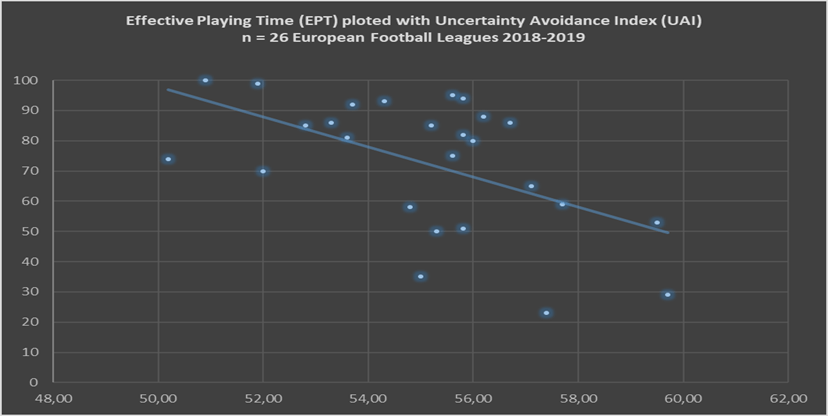
| Graphic N.º 7 – UAI & Effective Playing Time 2018-2019
|


Source: Author’s research based on data from CIES Football Observatory, 2018 and Hofstede Database
| Graphic 8 – PDI & Total Cards 2018-2019
|
| Graphic 9 – IDV & Total Cards 2018-2019
|
| Graphic 10 – UAI & Yellow Cards 2018-2019
|


Source: Author’s research based on data from CIES Football Observatory, 2018
5. From moderate (*) to strong (**) significant correlations
There is a strong negative association between Effective Playing Time and
- Total cards shown (r = -, 560 n= 26 football leagues)
- Uncertainty Avoidance (r= .537 n= 26 football leagues)
There is a moderate positive association between
Effective Playing Time (EPT) and
- Individualism – IDV – (r= 475, n = 26 football leagues) and
There is also a moderate positive association between Total Cards and
- PDI (r=.377 n= 35 football leagues)
- UAI (r= .623 n= 35 football leagues)
There is a negative and strong correlation between Total Cards Shown and
- IDV (r=.557 n= 35 football leagues)
There is a positive and strong correlation between Total Cards Shown and
- UAI (r=.623 n= 35 football leagues)
Red Cards & Yellow Cards 2018-2019
Worldwide -73 National Leagues
Table N.º3
Association Between National Cultures and Total Cards Shown, Red Cards & Yellow Cards
2019-2020 for 73 Countries/Football Leagues Worldwide
Correlations |
||||||||
| TCS | RC | YC | PDI | IDV | UAI | MAS | ||
| TCS | Pearson Correlation | 1 | ,752** | ,997** | ,294* | -,453** | ,524** | -,018 |
| Sig. (2 tails) | ,000 | ,000 | ,012 | ,000 | ,000 | ,880 | ||
| N | 73 | 73 | 73 | 73 | 73 | 73 | 73 | |
| RC | Pearson Correlation | ,752** | 1 | ,701** | ,298* | -,480** | ,470** | -,047 |
| Sig. (2 tails) | ,000 | ,000 | ,011 | ,000 | ,000 | ,693 | ||
| N | 73 | 73 | 73 | 73 | 73 | 73 | 73 | |
| YC | Pearson Correlation | ,997** | ,701** | 1 | ,285* | -,436** | ,515** | -,014 |
| Sig. (2 tails) | ,000 | ,000 | ,015 | ,000 | ,000 | ,906 | ||
| N | 73 | 73 | 73 | 73 | 73 | 73 | 73 | |
| PDI | Pearson Correlation | ,294* | ,298* | ,285* | 1 | -,704** | ,310** | ,129 |
| Sig. (2 tails) | ,012 | ,011 | ,015 | ,000 | ,008 | ,278 | ||
| N | 73 | 73 | 73 | 73 | 73 | 73 | 73 | |
| IDV | Pearson Correlation | -,453** | -,480** | -,436** | -,704** | 1 | -,330** | ,104 |
| Sig. (2 tails) | ,000 | ,000 | ,000 | ,000 | ,004 | ,381 | ||
| N | 73 | 73 | 73 | 73 | 73 | 73 | 73 | |
| UAI | Pearson Correlation | ,524** | ,470** | ,515** | ,310** | -,330** | 1 | -,060 |
| Sig. (2 tails) | ,000 | ,000 | ,000 | ,008 | ,004 | ,612 | ||
| N | 73 | 73 | 73 | 73 | 73 | 73 | 73 | |
| MAS | Pearson Correlation | -,018 | -,047 | -,014 | ,129 | ,104 | -,060 | 1 |
| Sig. (2 tails) | ,880 | ,693 | ,906 | ,278 | ,381 | ,612 | ||
| N | 73 | 73 | 73 | 73 | 73 | 73 | 73 | |
| **. Correlation is significant at level 0.01 (2 tails). | ||||||||
| *. Correlation is significant at level 0.05 (2 tails). | ||||||||
Source: Author’s research based on data from CIES Football Observatory, 2018 and Hofstede Database
Graphic 11
PDI & TOTAL CARDS

Source: Author’s research based on data from CIES Football Observatory, 2018 and Hofstede Database
Graphic 12
PDI & RED CARDS

Source: Author’s research based on data from CIES Football Observatory, 2018 and Hofstede Database
Graphic 13
Yellow Cards Shown associated whit PDI

Source: Author’s research based on data from CIES Football Observatory, 2018 and Hofstede Database
Graphic 14
IDV & TOTAL CARDS

Source: Author’s research based on data from CIES Football Observatory, 2018 and Hofstede Database
Graphic 15
IDV & RED CARDS

Source: Author’s research based on data from CIES Football Observatory, 2018 and Hofstede Database
Graphic 16
IDV & YELLOW CARDS

Source: Author’s research based on data from CIES Football Observatory, 2018 and Hofstede Database
Graphic 17
UAI & TOTAL CARDS

Source: Author’s research based on data from CIES Football Observatory, 2018 and Hofstede Database
Graphic 18
UAI & RED CARDS

Source: Author’s research based on data from CIES Football Observatory, 2018 and Hofstede Database
Graphic 19
UAI & YELLOW CARDS

Source: Author’s research based on data from CIES Football Observatory, 2018 and Hofstede Database
Conclusion
Football is a universally appreciated and practiced game and is based on relatively simple and equal rules wherever the game is played. The application of the rules resulting from its interpretation is however not exactly the same in all games and in all cultural contexts where the game is played.
Although the football teams of the top leagues in each country are increasingly composed of players from diverse cultures, in general the refereeing teams are composed of individuals from that specific league.
This is of course different in international games It is known that when a group (i.e., more than 3 people) moves from one cultural context to another, it carries with it the central tendency of the national culture of origin, that is, the characteristics of the mental software of their country and, probably, this can make oneself feel, albeit unconsciously, in the way the referees interpret what is happening in the field and if this is considered worthy of interruption and disciplinary sanction.
What the data seems to suggest is that, unconsciously, there is a sharp and persistent tendency for refereeing teams from cultures with mental software characterized by high power distance and a strong need for control, to show more cards.
Our suggestion is that the best way to cope with this reality is to make referees and players aware of it. As it has long been known that it is part of cockpit resource management in aviation to train crew members for more direct communication that allows co-pilots, in particular, to be able to make negative criticisms in a constructive sense to captains, and not to hesitate to call attention to errors or even correcting them.
It might be a good idea to integrate this also in the training of soccer referees and coaches a set of knowledge about cultures as mental software’s that work unconsciously on individuals in order to gain awareness of their characteristics and, eventually, adopt other behaviors that reduce not only the number of cards shown in football matches, but also allow, in this way, to increase the effective playing time.
To think that the referees, coaches and players will be able to improve behavior themselves is a mistake. Why? Because the truth is that “the fish don’t know that they live in the sea”.
Literature:
CIES Football Observatory, 2018
Hofstede, G., Hofstede, G.J., & Minkov, M. (2010). “Cultures and Organizations, Software of the Mind”, Third Revised Edition, McGrawHill 2010, ISBN 0-07-166418-1. ©Geert Hofstede B.V. quoted with permission
Wursten Huib. The 7 Mental Images of National Culture Leading and managing in a globalized word (2019) ISBN-10: 1687633347 ISBN-13: 978-1687633347
[1] In fact, they are so strong that there are people who fight and give their lives for them.
0 Comments